Graphy appData charts AI Tool
Create interactive data visualizations for businesses.
Data chartsFree + from $16/mo
Create interactive data visualizations for businesses.
Overall
Average of 2 data signals below
Basic pricing published
3 of 4 content areas filled (features, FAQs, pros/cons, description)
This score is calculated automatically from this listing's available data (community rating, capabilities, pricing transparency, and documentation). It is not a paid or sponsored review.
Pricing & Model
freemium
Free + from $16/mo
Open Source & API
Proprietary
No Public API
Foundational Model
Proprietary Engine
Key Integrations
Web App Only
Free + from $16/mo
See full pricing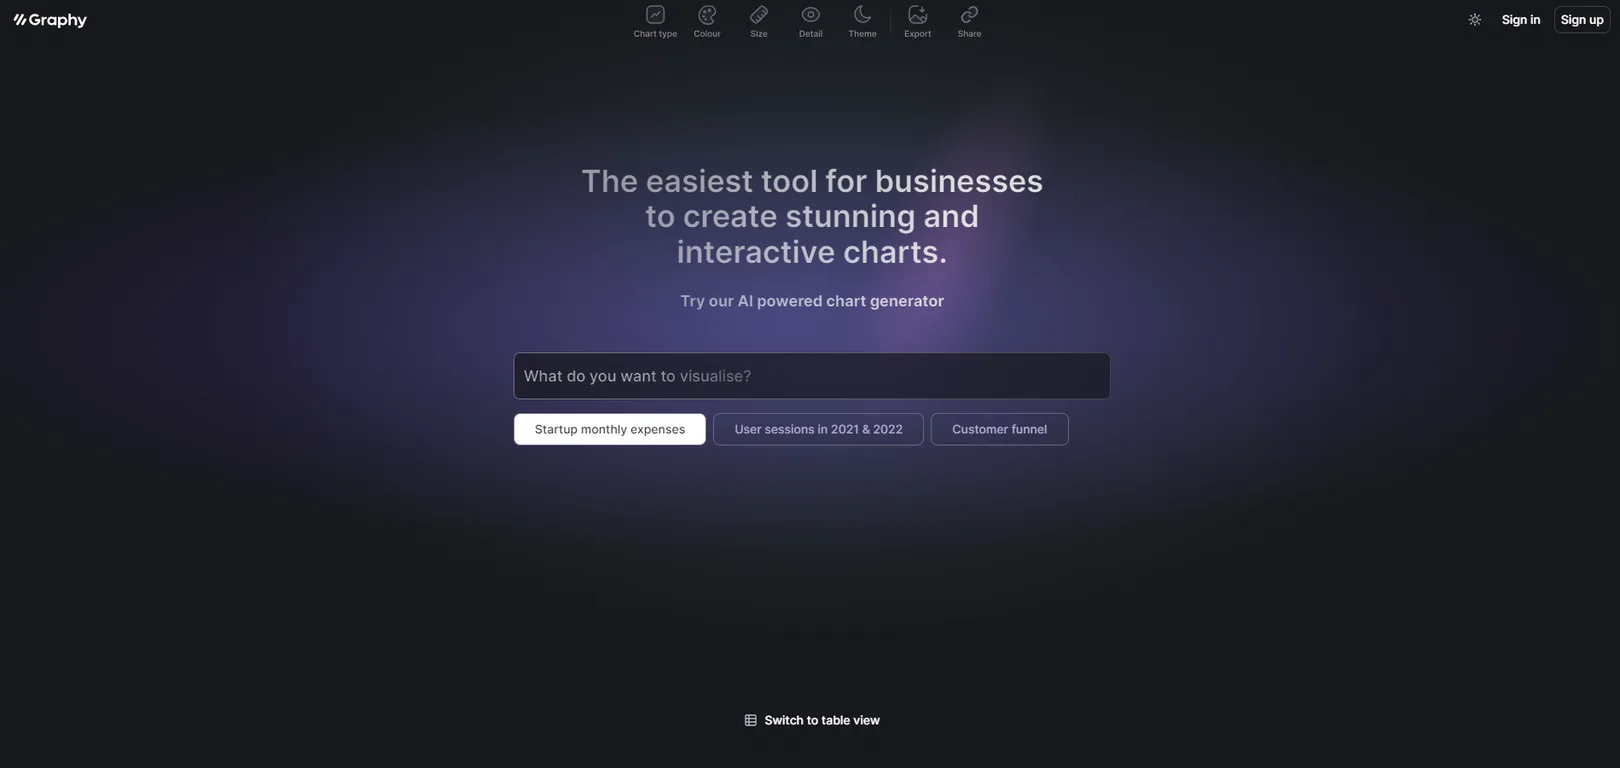
Common queries about Graphy app answered
Graphy is a free chart-maker tool powered by AI, which enables businesses to create interactive and slick data visualizations.
Key features of Graphy include a range of chart options, AI-powered quick chart generation, an option to switch to table view, the ability to embed charts into platforms like Notion, and an intuitive, user-friendly interface.
The AI in Graphy works by using advanced algorithms to process input data, identify patterns, and generate interactive and visually appealing charts. This helps users to create stunning charts without the need for technical expertise.
Real ratings and feedback from the community
Be the first to share your rating and comments for this AI tool!
How Graphy app stacks up against top competitors
| Feature | Graphy app | Graph Maker | ChartGPT Cadlabs | Napkin |
|---|---|---|---|---|
| Rating | ★ 3 | — | ★ 3 | — |
| Pricing Model | freemium | paid | Paid | freemium |
| API Access | No | No | No | No |
| Open Source | No | No | No | No |
| Link | Visit Website | Visit Website |
Explore similar AI tools in this category

To use Graphy for business, you simply need to input your data into the tool, choose a suitable chart type from a range of options, and allow the AI to generate your chart. The charts can then be embedded into your preferred applications for sharing and presentation.
Yes, Graphy offers multiple options for chart types. These can be used to represent different kinds of data, such as startup monthly expenses, user sessions in specific time frames, or customer funnel analysis.
Indeed, Graphy is designed for accessibility and does not require advanced technical skills to use. It's user-friendly interface and AI-powered capabilities enable anyone to create visually appealing charts.
To switch to a table view in Graphy, there's a dedicated option within the tool that allows you to seamlessly flip from a chart view to a more concise table representation of your data.
Yes, charts created using Graphy can be easily embedded into various platforms including Notion and other preferred applications.
Graphy indeed has a user-friendly interface. Its design is simple and intuitive, making it easily navigable for individuals with varying levels of technical expertise.
Speedy chart generation with Graphy comes from utilising its AI-powered capabilities. Just by entering your data into the tool and choosing a desired chart type, the AI algorithms handle the rest in an efficient manner.
Graphy is advertised as a free tool, there's no explicit mention of premium options on their website.
With Graphy, you can represent a wide range of data types. Examples include startup monthly expenses, user sessions over specific time frames, and customer funnel analysis.
The visual appeal of Graphy charts comes from the tool's ability to generate slick, interactive data visualizations. These are designed to be engaging, making data easier to understand and digest.
Graphy helps in making informed business decisions by enabling businesses to translate their data into visually insightful charts. This facilitates easy data interpretation, aiding in gaining insights and thus forming data-driven decisions.
While there isn't explicit information on sharing charts within teams, given Graphy's capabilities like embedding charts into Notion and other platforms, users should indeed be able to share the charts they create.
Graphy saves time and resources for businesses by eliminating the need for manual chart creation. It also reduces the requirement for specialized personnel, thanks to its user-friendly interface and AI-powered chart generation.
According to their website, Graphy charts can be embedded into platforms like Notion among others, indicating that the tool is compatible with multiple platforms.
Example data that Graphy can showcase includes startup monthly expenses, user sessions during specific time frames, and customer funnel analysis.
Although specific signup instructions are not stated on their website, there are 'Sign in' and 'Sign up' buttons visible, which suggest that users can sign up directly on the website for access to Graphy's features.
The privacy policy and terms of use can be found on Graphy's website, with respective links leading to these documents.
| Visit Website |
| Visit Website |
Fliki
Compare Fliki's free and paid tiers to see how this text-to-video AI tool simplifies social media, blog-to-video, and content marketing production.