

D&AVIZData visualization AI Tool
Transforming raw data into vibrant visuals.
Data visualization0
Transforming raw data into vibrant visuals.
Overall
Average of 1 data signal below
3 of 4 content areas filled (features, FAQs, pros/cons, description)
This score is calculated automatically from this listing's available data (community rating, capabilities, pricing transparency, and documentation). It is not a paid or sponsored review.
Pricing & Model
paid
Open Source & API
Proprietary
No Public API
Foundational Model
Proprietary Engine
Key Integrations
Web App Only
Common queries about D&AVIZ answered
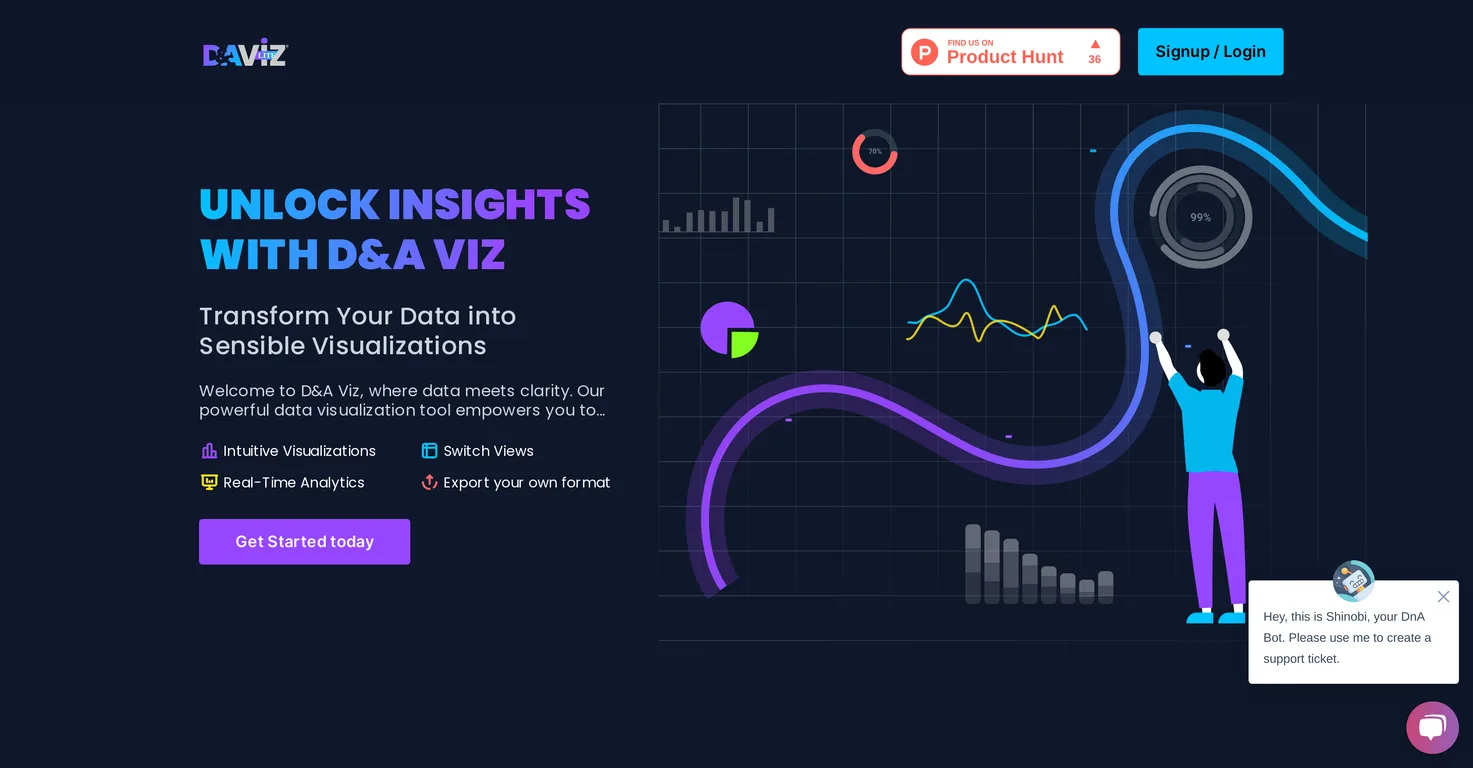
D&AVIZ is an AI-powered data visualization tool that turns raw data into interactive, easy-to-understand visuals. It takes complex numerical information and transforms it into visual representations such as graphs and charts, aiding users in identifying patterns, trends, and insights. Beyond visualization, it enables real-time monitoring and offers several visualization options, including customizability, view switching, and data exporting in various formats.
D&AVIZ works by importing data from numerous sources, processing the information, and transforming it into visualizations. Users communicate with D&AVIZ to get the reports they need and can customize these visualizations to suit their unique needs. Once the data has been visualized, users can explore the insights, then share them via interactive dashboards.
Real ratings and feedback from the community
Be the first to share your rating and comments for this AI tool!
How D&AVIZ stacks up against top competitors
| Feature | D&AVIZ | Polymer | PowerBI AI Lens | Supadash |
|---|---|---|---|---|
| Rating | ★ 3 | — | ★ 3 | — |
| Pricing Model | paid | freemium | paid | free_trial |
| API Access | No | No | No | No |
| Open Source | No | No | No | No |
| Link | Visit Website | Visit Website |
Explore similar AI tools in this category
Supercharge Your Power BI Dashboards with OpenAI and ChatGPT
D&AVIZ can import data from various sources, including but not limited to Excel and CSV files.
Yes, D&AVIZ can handle real-time data visualization, enabling accurate and timely performance monitoring.
D&AVIZ enables creation of a variety of visualizations, including but not limited to graphs and charts.
Yes, the visuals created with D&AVIZ are customizable. Users can tailor the visualizations to match their specific needs.
Dashboards created with D&AVIZ can be shared effortlessly, contributing to its importance as an effective data presentation tool.
Yes, users have the option to switch views in D&AVIZ, further enhancing its flexibility.
Data exporting in D&AVIZ is highly flexible. Users can export data in a variety of formats, which supports versatility in data usage.
Yes, D&AVIZ can transform complex numerical information into visually intelligible formats like charts.
D&AVIZ aids with data analysis and presentation by converting complex data into easily understandable visual representations. These visualizations illuminate patterns, trends, and insights, supporting informed decision-making. The ability to customize charts and share dashboards enhances its usefulness in data presentation.
D&AVIZ can accept data imports in the Excel and CSV file formats.
Yes, D&AVIZ is useful in identifying data patterns and trends. Its visualizations allow users to easily recognize patterns, trends, and insights in the data presented.
Absolutely, D&AVIZ has a clear function of simplifying complex data. By transforming intricate numerical information into visual formats such as graphs and charts, D&AVIZ makes complex data more comprehensible.
Yes, offering dynamic insights is a core functionality of D&AVIZ. Its real-time data visualization allows businesses to monitor key metrics and performance indicators, facilitating prompt responses and adjustments.
D&AVIZ contributes to informed decision-making by transforming data into visuals that can be quickly and easily understood. This visualization of information allows decision-makers to grasp the data more efficiently, thus making faster and better-informed decisions.
Yes, D&AVIZ does present data in an engaging way. Its visualization methods, such as graphs and charts, captivate audiences, making data presentations memorable and impactful.
Yes, there are testimonials from users of D&AVIZ. Users have recommended D&AVIZ for its intuitive visualizations, real-time analytics, versatility in data exporting, and efficiency in processing and rendering large datasets.
Yes, you can try D&AVIZ for free. The website offers a free trial for new users.
To contact the D&AVIZ team, you would need to provide your name, email address, and message on the provided contact form on their website.
| Visit Website |
| Visit Website |

Lovable
Lovablev2.2 turns your app ideas into live web apps instantly with AI and simple prompts-no coding required for fast MVPs and prototypes.


