

PlotCh.atDatabase Q&A AI Tool
Chat with your image data
Database Q&A0
Chat with your image data
Overall
Average of 1 data signal below
3 of 4 content areas filled (features, FAQs, pros/cons, description)
This score is calculated automatically from this listing's available data (community rating, capabilities, pricing transparency, and documentation). It is not a paid or sponsored review.
Pricing & Model
freemium
Open Source & API
Proprietary
No Public API
Foundational Model
Proprietary Engine
Key Integrations
Web App Only
Common queries about PlotCh.at answered
PlotCh.at can extract comprehensive data from images containing plots, graphs, and other visual data representations. The data extracted by PlotCh.at covers key metrics and values represented in the image, whether they are explicit (presented directly) or implicit (derived from the visual representation).
PlotCh.at uses Google's Deplot technology for data-in-image comprehension. This technology aids in accurately decoding numerical and symbolic data pointed out in the visual representations within images, therefore allowing PlotCh.at to extract precise data for further interpretation and analysis.
Real ratings and feedback from the community
Be the first to share your rating and comments for this AI tool!
How PlotCh.at stacks up against top competitors
| Feature | PlotCh.at | Edward | Llamaindex | VizGPT by CorpusX |
|---|---|---|---|---|
| Rating | ★ 3 | — | — | ★ 3 |
| Pricing Model | freemium | paid | freemium | Paid |
| API Access | No | No | No | No |
| Open Source | No | No | No | No |
| Link | Visit Website | Visit Website |
Explore similar AI tools in this category
PlotCh.at aids in data analysis by not only extracting data from images but also providing interpretive insights and narratives based on the data. It does this by decoding the data represented in visual formats such as graphs and plots, converting it into a tabular format that is easier to understand and analyze.
You can upload any image on PlotCh.at that contains plots, graphs, and visual data representations. As long as the image contains some form of data visualization, PlotCh.at can interpret it.
PlotCh.at uses sophisticated AI algorithms to decode the data from graphical presentations into a tabular format. It identifies key landmarks and data points in the graph, and then precisely pinpoints and quantifies these data points with their corresponding values and metrics. This data is then systematically arranged in a tabular format for enhanced comprehension and further analysis.
PlotCh.at provides data interpretations by extracting and decoding the data in the image uploaded and creating comprehensive insights about the same. It then provides explanations for these insights which are easy to understand and evaluate. These explanations give meaning to the raw data and enable users to understand and engage with their data in a deeper manner.
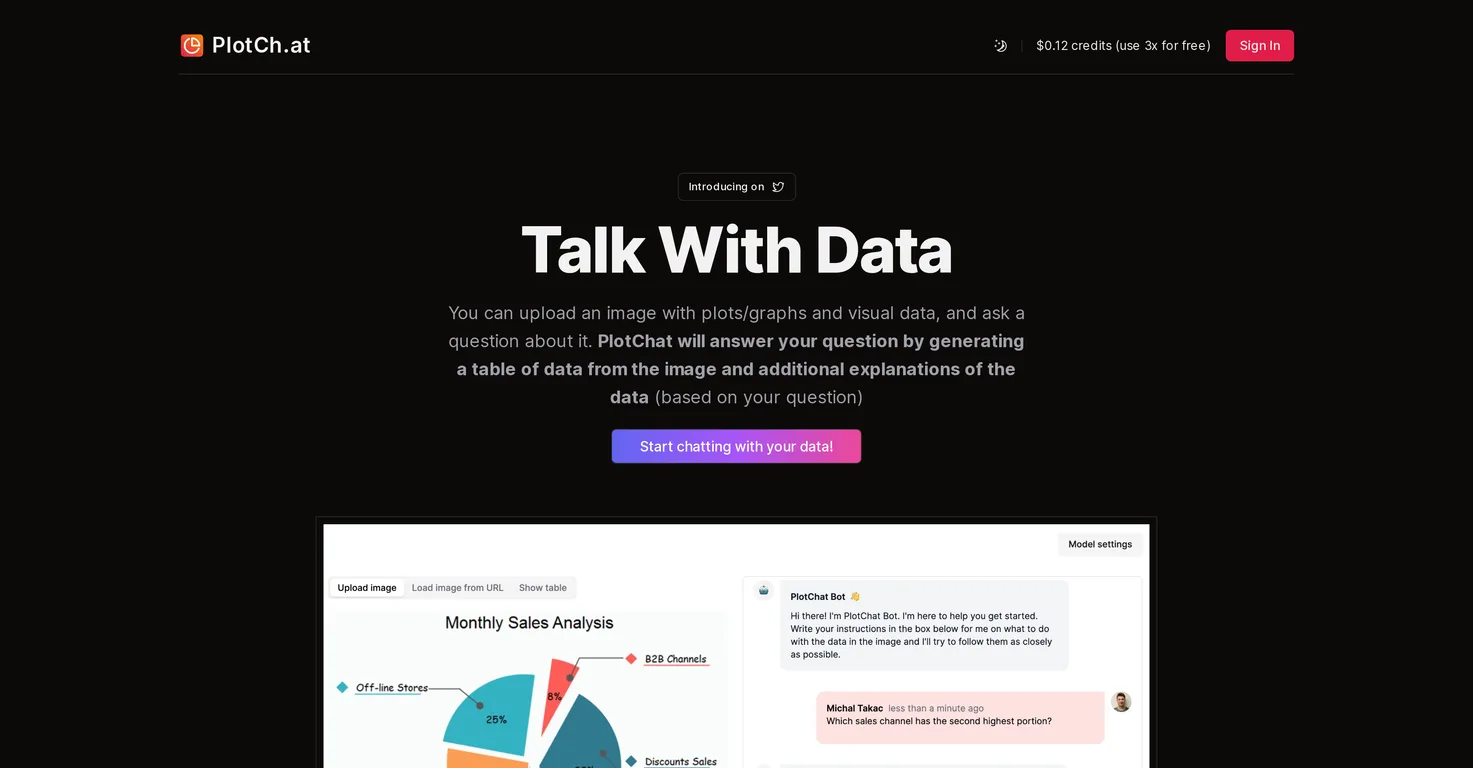
PlotCh.at facilitates an interactive conversation with the data by providing a platform where users can upload an image with data, ask specific questions about the data in the image, and receive detailed answers and explanations. This interactivity allows for a more engaging and holistic data analysis process.
Yes, PlotCh.at can provide in-depth insights and narratives from graphs. The interpretations are based on the decoded data from the graph and follow the natural progression of the graph, providing a comprehensive and detailed explanation of the data, trends, and patterns visualized in the graph.
PlotCh.at has technical support powered by tools such as Next.js, Prisma, Vercel, AuthJS, Shadcn UI, and Stripe. These tools collectively power the technical back-end of the platform ensuring a smooth and efficient user experience.
Michal Tak has developed PlotCh.at.
Absolutely, PlotCh.at can be extremely useful in scientific research where complex graphical data often needs to be decoded, understood, and analyzed. By converting complex graph data into an easy-to-understand tabular format, PlotCh.at makes data analysis in scientific research more accessible.
The technical back-end of PlotCh.at is supported by Next.js, Prisma, Vercel, AuthJS, Shadcn UI, and Stripe.
PlotCh.at makes complex graph data easy to understand by extracting the data from the graph, decoding it, and then presenting it in a user-friendly tabular format. Additionally, it provides interpretations and comprehensive insights about the data, adding greater context and making it easier for users to understand.
To start a chat with your data in PlotCh.at, you need to upload an image containing plots/graphs and visual data. After the image is uploaded, you can ask a specific question about the data in the image. PlotCh.at will then answer your question by generating a table of data from the image and providing additional explanations of the data based on your question.
What makes PlotCh.at a unique tool for data extraction is its combination of image analysis and interactive data conversation. It not only extracts data from visuals but also allows for questions about the data to be answered in a detailed and understandable manner.
To ask a question about your data in PlotCh.at, you upload an image containing visual data representations. You can then pose a specific question about the data. PlotCh.at will interpret the image, extract the data, and provide explanations based on your question.
PlotCh.at primarily analyzes data represented graphically within images. It interprets the graph, extracts the corresponding data, and provides related explanations. As for tabular data within images, as long as it is part of a visual data representation like a graph, PlotCh.at is capable of extracting and analyzing it.
The pricing options for using PlotCh.at are not explicitly mentioned on their website.
The data security measures implemented by PlotCh.at are not explicitly mentioned on their website.
Yes, PlotCh.at can interactively extract data from any visual data representations including but not limited to graphs and plots. It does this by interpreting the image, extracting the represented data, and providing relevant interpretations and explanations.
| Visit Website |
| Visit Website |

Lovable
Lovablev2.2 turns your app ideas into live web apps instantly with AI and simple prompts-no coding required for fast MVPs and prototypes.


